Monthly Market Recap – January 2024
More of the same…
The trends of late last year continued to show economic strength with U.S. gross domestic product growing a strong 3.1% in 2023.
Consumption continues to reflect the relatively good health of consumers, albeit with a bit less pace than previously witnessed.
Inflation continues to moderate with core Inflation slowing to 3.93% in December, the first time it has fallen below 4% since May 2021.
The battle between market expectations of when and at what pace the Federal Reserve will cut rates will likely continue throughout this year. Investors had been anticipating as many as 6 or 7 rate cuts this year, with the first one being as early as March. However, The Fed's statement at their January meeting stressed the need for continuing evidence that inflation has been stabilized on a sustained basis before it will be appropriate to begin the easing cycle, sending a strong signal to the market that there likely will be no rate cut in March. Conditions would have to weaken significantly to reach even three rate cuts this year.
US stocks posted modest gains to start the year. The Dow Jones Industrial Average rose 1.3%, the S&P 500 advanced 1.7%, and the NASDAQ added 1.0%. Large-caps fared better than Small-caps in January–the Russell 1000 index increased 1.4%, while the Russell 2000 dropped 3.9%. Growth outperformed value within both indices.


*10

*1
Five of eleven sectors had a positive start to 2024. Communication Services was January’s sector leader with a 4.4% gain, followed by Financials at 3.1%. The laggards this month were Materials, Consumer Discretionary, and Real Estate, the last of which posted a 4.8% decline.

*2
The Economic Data Rundown
US Treasury Yields
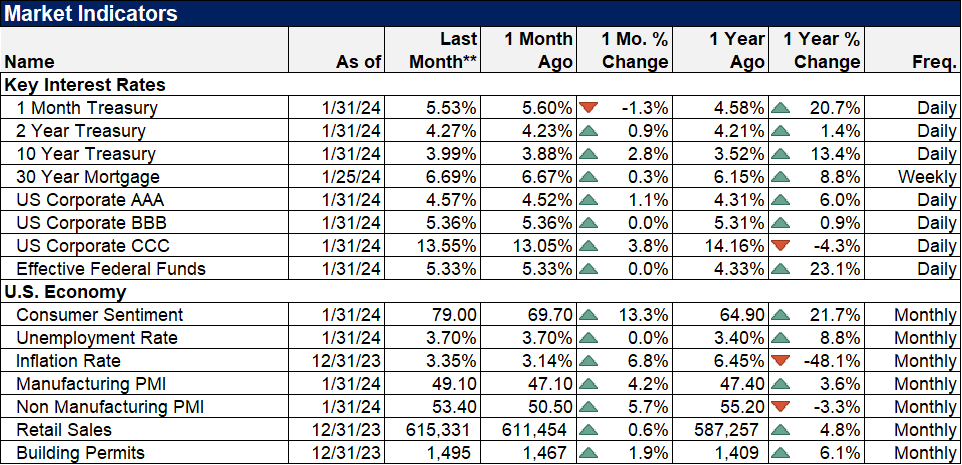
Treasury yields had an uneventful start to the year as longer-term treasuries posted slight increases. The 30-year rose 19 basis points to 4.22%, the most of any duration. The 1-month, 6-month, and 1-year T-Bills all fell by single-digit basis points.
Employment
January’s unemployment rate stayed unchanged at 3.7%, as did the labor force participation rate at 62.5%. The US unemployment rate has now come in at 3.7% for three consecutive months. In January, 353,000 new jobs were added according to nonfarm payroll data, far surpassing the expected increase of 185,000.
Consumers and Inflation
The US inflation rate for December clocked in at 3.35%, marking a slight Month-over-Month (MoM) increase. Inflation has hovered between 3-4% since May. Core Inflation slowed to 3.93% in December, the first time it has fallen below 4% since May 2021. The monthly US Consumer Price Index rose 0.3% in December, and monthly US Personal Spending increased 0.7%. The Federal Reserve held its key Fed Funds Rate at 5.50% at its January 31st, 2024 meeting, marking the Fed’s fourth consecutive meeting in which rates were left unchanged.
Production and Sales
The US ISM Manufacturing PMI jumped two points higher to 49.1 in January, bringing it within one point of crossing into expansion territory. December US Retail and Food Services Sales rose 0.55% MoM, while the YoY US Producer Price Index increased 0.98%.
Housing
US New Single-Family Home Sales rebounded by 7.97% MoM in December after two consecutive monthly declines. However, MoM US Existing Home Sales slipped 1.1%. The Median Sales Price of Existing Homes fell for the sixth straight month to $382,600 in December, a monthly decline of 1.3%, and is 6.7% below its all-time high set in June 2023. Mortgage rates had little movement to start the year; the 15-year Mortgage Rate was 5.94% as of February 1st, and the 30-year stood at 6.63%.
Commodities
The price of Gold declined 2.1% in January to $2,018.50 per ounce. Crude oil prices pushed higher in January; the price of WTI ended the month at $75.84 per barrel while Brent was $83.99, with respective monthly increases of 6.9% and 8.1%. The average price of gas fell 2 cents per gallon in January despite the higher oil prices, closing the month at $3.21/gallon.
*3, 4, 5, 6, 7, 8, 9
As always, don’t hesitate to contact us if you have any questions about what impact, if any, this may have on your financial plan.
For more great insights, highlights, and financial education,
follow MDL Wealth Management on:
Content in this material is for general information only and not intended to provide specific advice or recommendations for any individual. All performance referenced is historical and is no guarantee of future results. All indices are unmanaged and may not be invested into directly.
Companies mentioned are for informational purposes only. It should not be considered a solicitation for the purchase or sale of the securities. Investing involves risks, and investment decisions should be based on your own goals, time horizon, and tolerance for risk.
The economic forecasts set forth in this material may not develop as predicted, and there can be no guarantee that strategies promoted will be successful.
The Dow Jones Industrial Average is comprised of 30 stocks that are major factors in their industries and widely held by individuals and institutional investors.
The NASDAQ Composite Index measures all NASDAQ domestic and non-U.S. based common stocks listed on The NASDAQ Stock Market. The market value, the last sale price multiplied by total shares outstanding, is calculated throughout the trading day, and is related to the total value of the Index.
The Bloomberg U.S. Aggregate Bond Index is an index of the U.S. investment-grade fixed-rate bond market, including both government and corporate bonds.


3Department of the Treasury
4Bank of America Merrill Lynch
5Federal Reserve
6University of Michigan
7Bureau of Labor Statistics
8Institute for Supply Management
9Census Bureau